.png)
IGIN TECH 2023
Infection Prevention through Hygienic Glove Donning and Disinfection, Powered by Data Dashboards
UX Research | UI Design
Medical-Tech ERP


.png)
.png)
Dual dashboards for two distinct end-users
.png)


OVERVIEW
How it all began
On October 7, I initiated volunteer projects to support hundreds of thousands in need — victims, evacuees, reservists, and more.
I shared calls for help across multiple media platforms to recruit volunteers and collect donations for my organizations, Very quickly,
I received an overwhelming number of messages from people eager to help, but unsure how to get involved or contribute effectively.

Photos of me leading and participating in volunteer initiatives after October 7
OVERVIEW
What is IGIN?
IGIN is a physical machine for hygienic glove donning and disinfection, supported by a complex data system. The dashboards serve organizations such as hospitals, clinics, restaurants, and laboratories, highlighting waste and hygiene breaches to ensure efficiency and infection prevention.
IGIN machine, disposable gloves, and hand sanitizer - the core elements of the system

BACKGROUND
I was deeply moved by the sheer number of citizens eager to volunteer, yet struggling to find practical ways to help.
I was deeply moved by the sheer number of citizens eager to volunteer, yet struggling to find practical ways to help.
I began personally matching volunteers — based on their skills, interests, and availability — with the many civilian aid centers that sprang up immediately after the attacks. Seeing the powerful impact this had on both volunteers and people in need, I decided to create a social tech solution that would scale and automate what I was doing manually.

My sketchbook documenting the research and planning process
BACKGROUND
Preventing Infections
As the product and UX designer, my role was to transform IGIN from a physical hygiene machine into a comprehensive system experience. I focused on bridging the gap between the operational pain points of executives and the daily needs of end-users, creating dashboards and data flows that reveal inefficiencies, improve hygiene, and support decision-making at scale.

My sketchbook - documenting the early stages of research, ideation, and design
THE social tech solution
I began personally matching volunteers — based on their skills, interests, and availability — with the many civilian aid centers that sprang up immediately after the attacks.
Seeing the powerful impact this had on both volunteers and people in need, I decided to create a social tech solution that would scale and automate what I was doing manually.

My sketchbook documenting the research and planning process
UX RESEARCH
Poor Glove Use: 48% Waste, 500 Preventable Deaths
Poor glove usage leads to nearly 48% waste and contributes to over 500 preventable hospital deaths annually. These numbers highlight the urgent need for a hygienic, efficient solution - ensuring proper glove donning, reducing waste, and preventing infections through accurate usage tracking.
.png)

Data insights highlighting waste rates and the human cost of poor glove practices
Data analysis
I began by researching and analyzing data on volunteering trends and behaviors in the aftermath of October 7.
At this early stage, I focused on researching and analyzing data to understand the scale of the need and the opportunities for impact.

Graphs and data visualizations showing volunteer rates after October 7

UX RESEARCH
Identifying pain points and needs
I conducted interviews with volunteers, non-volunteers, and volunteer centers, using both open-ended and targeted questions to uncover their pain points and needs, ensuring the solution would be truly user-centered.

Graphs from user interviews, by sections volunteers, non-volunteers, and volunteer centers — showing what they want, feel, and need.
user interviews
Understanding stakeholder needs to design tailored dashboards
I conducted in-depth interviews with IGIN’s CEO and a hospital COO to identify their goals, challenges, and expectations. The insights from these discussions shaped the structure, KPIs, and data hierarchy of the dashboards, ensuring each user received the information most relevant to their role.
.png)
Interview insights visualized - mapping key needs and priorities of each stakeholder.
Observing How Volunteers & Centers Actually Operate
I researched existing volunteer platforms to identify what was missing and where they fell short.
In addition, I observed volunteer centers and volunteers themselves to see firsthand how they currently manage sign-ups, how centers recruit, and how shifts are scheduled. This helped me pinpoint critical gaps and inefficiencies that my solution could address.

A table comparing existing platforms
Competitive Analysis
Competitive Gap Analysis - Missing Glove Usage Tracking
Our competitive research found no existing system that monitors comprehensive disposable glove usage data - including change frequency, correlation to performed tasks, and compliance with hygiene protocols.
After evaluating various related technologies, we identified ERP systems as the most suitable foundation for integrating IGIN’s capabilities.
.png)
Comparative analysis highlighting gaps in existing market solutions
UX STRATEGY
Turning research into a strategy
I began synthesizing all my research findings to build an effective, user-centered solution for the crisis. This included developing end-to-end personas that represented key user segments, ensuring the product would address their real needs, motivations, and frustrations.
.png)
End-to-end personas and research synthesis.
.png)
UX STRATEGY
Designing a System Around the People Who Use It
Following user research, I developed detailed personas representing IGIN’s key stakeholders. Each dashboard was tailored to their specific needs - ensuring decision-makers could act quickly and operational staff could work efficiently without unnecessary complexity.
.png)
.png)
Personas illustrating the distinct goals, challenges, and workflows of IGIN’s stakeholders
Information Architecture
Structuring Data for an Accurate, Actionable Flow
I organized all required data into a clear, logical hierarchy - ensuring that critical information was easily accessible, supporting precise navigation and decision-making within the dashboard.


Information architecture blueprint mapping all content and connections
UX STRATEGY
Turning research into a strategy
I began synthesizing all my research findings to build an effective, user-centered solution for the crisis. This included developing end-to-end personas that represented key user segments, ensuring the product would address their real needs, motivations, and frustrations.
End-to-end personas and research synthesis.
Solution Sketching
I translated all the research and strategy into visual concepts by sketching the solution.
This helped me explore the structure, interactions, and key features before moving to detailed design.
.png)
Low-fidelity wireframes.
Wireframes
Building Flows Around Immediate Needs and Perfect Navigation
Using the information architecture as a guide, I created wireframes to define layout, functionality, and navigation - ensuring that users could access essential data with minimal effort and maximum clarity

Wireframes demonstrating optimized flow and navigation patterns

Onboarding
Smart Onboarding with Purpose
The onboarding flow recognizes each user’s motivation and adapts in real time — guiding them to the opportunities that fit them best.
It’s not just registration. It’s connection, from the first screen.
.png)
Personalized onboarding
UI DESIGN
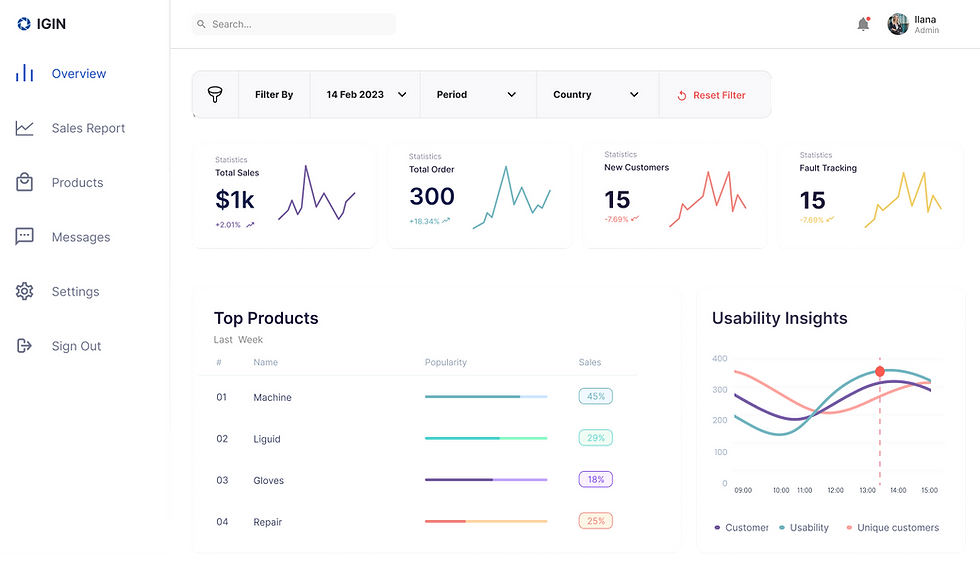
Usability Testing for a Professional, Accessible Experience
I refined the dashboard’s interface through usability testing, ensuring the design was both visually appealing and highly functional. The final UI is clean, professional, and accessible — supporting fast, confident decision-making.
.png)
CEO Dashboard – global sales and usability insights for glove-donning devices
App Screens & Prototype
Fast. Familiar. Focused.
The UI feels like a familiar OS — so users know exactly what to do. Every screen flows naturally, collecting the right info at the right time through pop-ups, forms, and prompts. It’s smooth, efficient, and built for action.
.png)
Admin Dashboard
Built for Centers, Too
I designed the desktop dashboard for volunteer centers — with clear flows, smart pop-ups, and intuitive forms. Each feature encourages repeat use and smooth coordination — so volunteering becomes easier, faster, and scalable.
Admin Dashboard daily operations overview for hospital departments
Admin Dashboard
Built for Centers, Too
I designed the desktop dashboard for volunteer centers — with clear flows, smart pop-ups, and intuitive forms. Each feature encourages repeat use and smooth coordination — so volunteering becomes easier, faster, and scalable.

BACKGROUND
I was deeply moved by the sheer number of citizens eager to volunteer, yet struggling to find practical ways to help.
I was deeply moved by the sheer number of citizens eager to volunteer, yet struggling to find practical ways to help.
I began personally matching volunteers — based on their skills, interests, and availability — with the many civilian aid centers that sprang up immediately after the attacks. Seeing the powerful impact this had on both volunteers and people in need, I decided to create a social tech solution that would scale and automate what I was doing manually.
My sketchbook documenting the research and planning process

.png)
I was deeply moved by the sheer number of citizens eager to volunteer, yet struggling to find practical ways to help.
I was deeply moved by the sheer number of citizens eager to volunteer, yet struggling to find practical ways to help.
I began personally matching volunteers — based on their skills, interests, and availability — with the many civilian aid centers that sprang up immediately after the attacks. Seeing the powerful impact this had on both volunteers and people in need, I decided to create a social tech solution that would scale and automate what I was doing manually.
My sketchbook documenting the research and planning process
I was deeply moved by the sheer number of citizens eager to volunteer, yet struggling to find practical ways to help.
I was deeply moved by the sheer number of citizens eager to volunteer, yet struggling to find practical ways to help.
I began personally matching volunteers — based on their skills, interests, and availability — with the many civilian aid centers that sprang up immediately after the attacks. Seeing the powerful impact this had on both volunteers and people in need, I decided to create a social tech solution that would scale and automate what I was doing manually.
My sketchbook documenting the research and planning process
I was deeply moved by the sheer number of citizens eager to volunteer, yet struggling to find practical ways to help.
I was deeply moved by the sheer number of citizens eager to volunteer, yet struggling to find practical ways to help.
I began personally matching volunteers — based on their skills, interests, and availability — with the many civilian aid centers that sprang up immediately after the attacks. Seeing the powerful impact this had on both volunteers and people in need, I decided to create a social tech solution that would scale and automate what I was doing manually.
My sketchbook documenting the research and planning process

I began by researching and analyzing data on volunteering trends and behaviors in the aftermath of October 7.
At this early stage, I focused on researching and analyzing data to understand the scale of the need and the opportunities for impact.
Graphs and data visualizations showing volunteer rates after October 7
Identifying pain points and needs
I conducted interviews with volunteers, non-volunteers, and volunteer centers, using both open-ended and targeted questions to uncover their pain points and needs, ensuring the solution would be truly user-centered.

Graphs from user interviews, by sections volunteers, non-volunteers, and volunteer centers — showing what they want, feel, and need.

Identifying pain points and needs
I conducted interviews with volunteers, non-volunteers, and volunteer centers, using both open-ended and targeted questions to uncover their pain points and needs, ensuring the solution would be truly user-centered.
Graphs from user interviews, by sections volunteers, non-volunteers, and volunteer centers — showing what they want, feel, and need.